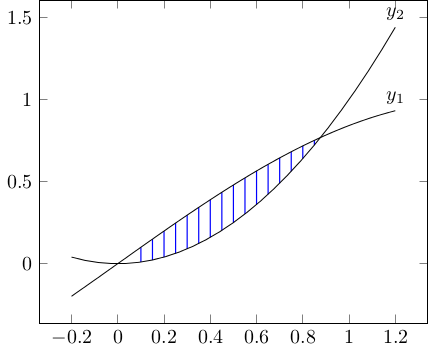
A friend wanted to 3D-print a shape to demonstrate using calculus to find the volume of solids of known cross-section. The shape he wanted was a graph of $sin(x)$ vs $x^2$, where each vertical slice of the intersection was a square. Here's the graph, with $y_1 = sin(x)$ and $y_2 = x^2$. The blue lines show the edge of each square. He couldn't figure out how to do this in a CAD program (I'm not even sure if it's possible), so he asked me if I could write some code to render it.
The first attempt I made was written directly in OpenSCAD;
I wrote a small loop to union together a collection of cube() calls, one for each slice.
This had several problems, however.
First, because I was using cubes it looked very chunky unless the slices were very small.
Second, I ran into a bug in OpenSCAD
which causes something like $O(n^2)$ performance for this scenario
and the file took about 2 hours to render.
Finally, the STL file it emitted was 1.8 MB and crashed the slicer.
Clearly, this solution was not going to work.
Instead, I wrote a python script to output an OpenSCAD file containing a single polyhedron,
which I could then render into an STL file and hand off to him to slice and print.
In addition to not crashing the slicer,
this approach also had the advantage of allowing the resolution to be much coarser
while still avoiding the 'stair-step' problem of the original multiple cube() approach.
Setting up
First, the formulae:
38 | |
$sin(x) = x^2$ is true for $x = 0$ and $x \approx 0.876$, so that's where I'll start and stop.
42 | |
I'll draw 50 slices, and scale everything up by 30.
46 | |
OpenSCAD's polyhedron() function
takes two arguments, points and triangles.
(Versions 2014.03 and later can also take faces instead of triangles, but I'm still using 2014.01.)
points is a list of $[x, y, z]$ triplets, and triangles then indexes into the list of points to build the triangles.
I therefore make a function point(x, y, z)
which will save the point into the list and return the index into this list.
Most of the program then works using these indexes, rather than the actual point coordinates.
56 | |
Slicing the shape

I slice the shape into SLICES slices, and output the above square for each slice.
This is also where I convert the coordinates into point-list indexes as explained above.
68 | |
Building the polyhedron
All of these slices I have are inside the shape, which isn't the part that's visible. The next step is to get all of the faces of the polyhedron by connecting the edge of adjoining slices into quadrilaterals.
First, I make an "end cap" using the slice at the start of the shape. This is necessary because otherwise the end will be left 'open' if the first slice is not of size 0, and the shape cannot be exported because it is not a valid 2-manifold.
90 | |

Next I generate quadrilaterals conecting each of the sides of ajoining slices. Doing this is relatively simple:
(Notice that they all go clockwise when facing outward.)
111 | |
122 | |
Convert quadrilaterals into triangles

I now have a list of faces for the polyhedron. For newer versions of OpenSCAD I could just pass this list in to the polyhedron() function; unfortunately as I mentioned before my version of OpenSCAD only accepts a list of triangles.
Therefore, I take each face (a quadrilateral $\square F_0 F_1 F_2 F_3$) and divide it into two triangles, $\triangle F_0 F_1 F_3$ and $\triangle F_1 F_2 F_3$. (Again, I'm being very careful to keep them in clockwise order.)
128 | |
Write the file
Finally, I print out the OpenSCAD file, which simply consists of a single call to polyhedron():
135 | |
And finally, here's what the shape looks like when it's printed out. In addition to the Python program linked at the top of this post, you can also download the OpenSCAD file and the STL file.

