A tiny plaintext accounting tool
I have been doing some financial planning, and needed to make sure I hadn’t gotten mixed up when trying to keep track of how much money will be where at some point in the future as I shuffle it around between accounts. The spreadsheet I tried to build got unwieldy quickly and I decided I needed a special-purpose tool. I’ve heard of hledger and beancount, and briefly tried them out a few years ago, but they do way more than I needed for this task and I wanted to avoid getting distracted by learning a new tool. So in the end I coded up a special-purpose tool to help, and it seemed interesting enough that I decided to write about it here.
Rendering a 3D shape with Python

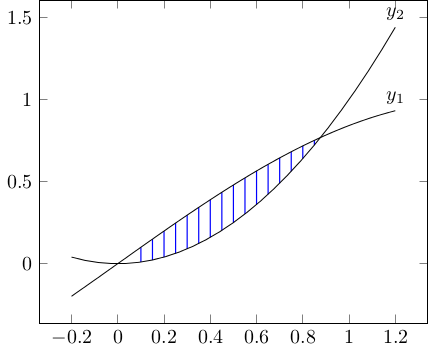
A friend wanted to 3D-print a shape to demonstrate using calculus to find the volume of solids of known cross-section. The shape he wanted was a graph of $sin(x)$ vs $x^2$, where each vertical slice of the intersection was a square. Here's the graph, with $y_1 = sin(x)$ and $y_2 = x^2$. The blue lines show the edge of each square. He couldn't figure out how to do this in a CAD program (I'm not even sure if it's possible), so he asked me if I could write some code to render it.